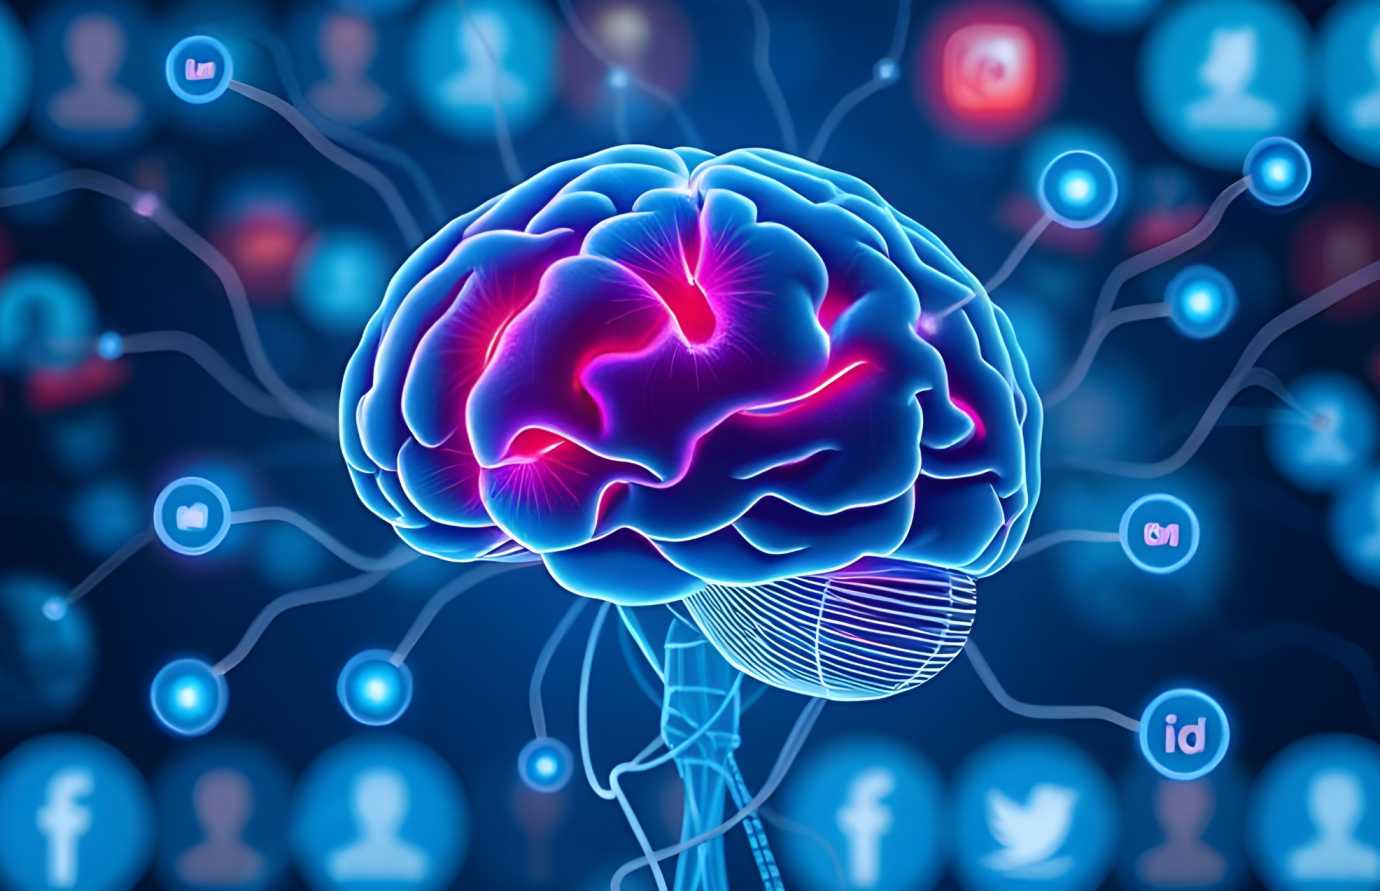
Modern Day High: Brain on Social Media as Cheap dopamine
Abstract:
The definition of fun has changed with changing times and different cohorts of people. The increasing use of social media to share personal life and experiences raises questions about whether and how social media alters those experiences, creating a sense of pleasure or enjoyment leading to dopamine spikes. In this study of 100 subjects, we carried out an EEG evaluation to investigate how our brains respond to social media engagement. The plan was to observe how various brainwave patterns change as people view content and engage with it. It was observed that Alpha waves dropped during social media use but returned after, while Beta and Gamma waves spiked with engagement, staying high for intense content. Theta and Delta waves slightly increased with passive browsing or prolonged use, indicating reflection, fatigue, and cognitive processing.
Methods and Materials:
Brain Activity Measurement
We used Electroencephalography (EEG) for data monitoring, and collection was done at 512 Hz using a 32-bit EEG recording system with 24 channels, which followed a 10-20 system scalp montage. The 10-20 system ensures consistent electrode placement across different individuals. The system di- vides the skull into increments of 10% to 20% of the total head size, ensuring that electrodes are placed over all major brain regions.
EEG Data Preprocessing
The EEG data underwent a multiple preprocessing pipeline to ensure the removal of artifacts and to prepare the signal for subsequent analysis. The preprocessing was performed using the MNE- Python toolbox, ensuring high fidelity of brain activity by eliminating various forms of noise and signal distortions.
A.Band-Pass and Notch Filtering
EEG data is inherently noisy due to various external and physiological sources of interference. To address this, we applied a zero-phase band-pass filter between 0.1 Hz and 50 Hz. Frequencies below 0.1 Hz, often attributed to slow drifts such as electrode shifts and sweat artifacts, were excluded, as were frequencies above 50 Hz, which typically reflect muscle activity and environmental noise. Furthermore, a notch filter was employed at 50 Hz to remove the pervasive power line noise from the data. The combination of band-pass and notch filtering allowed us to retain brain activity signals within the physiologically relevant range while effectively suppressing noise from non-neural sources.
B.Artifact Removal using Independent Component Analysis (ICA)
To ensure the removal of artifacts associated with eye blinks, muscle movements, and cardiac activity, we performed Independent Component Analysis (ICA). ICA decomposes the EEG data into independent components, allowing us to isolate and remove non-neural signals while preserving the neural information.
1.Eye Blinks were identified by their pronounced frontal distribution and slow temporal dynamics, which manifest predominantly in the frontal electrodes.
2.Muscle Activity often resulted in high frequency oscillations, particularly in scalp regions close to facial muscles. These components were characterized by their high frequency and were localized to specific electrodes.
3.Cardiac Artifacts (ECG) were recognized for their steady rhythmic pattern, in sync with the subject’s heart rate. These parts were taken out to avoid the EEG signal being contaminated by cardiovascular activity.
Post-ICA, a thorough visual inspection was conducted to ensure that only components associated with artifacts were removed, retaining the integrity of the underlying brain signals.
C. Re-referencing to Common Average Reference (CAR)
The EEG data were re-referenced to the common average reference (CAR), a standard practice in EEG analysis to minimize local reference biases and improve signal comparability across channels. In this method, the average of all electrode signals was computed and subtracted from each channel’s po- tential. Re-referencing in this manner enhances the uniformity of the EEG signal and reduces spatially localized noise, thus improving the robustness of subsequent analysis.
D.Epoching and Baseline Correction
The continuous EEG signal was segmented into epochs centered around stimulus events, enabling time-locked analysis of the brain’s response to the experimental conditions. Epoching involved extract- ing time windows from the EEG data, typically starting from 200 ms before to 1000 ms after the onset of each event.To mitigate the effects of any pre-stimulus noise or drift, a baseline correction was applied. The baseline point, usually the average signal strength before the stimulus in the 200 ms period, was deducted from every epoch. This process made sure that any pre-stimulus activity was eliminated, leading to a better understanding of event-related potentials (ERPs) and other changes in brain activity related to events.
E. Downsampling
The EEG data were initially recorded at a sampling rate of 512 Hz, which provides high temporal resolution but can impose significant computational demands during processing. To optimize computational efficiency without losing critical information, the data were downsampled to 250 Hz. This reduced the data volume while still retaining sufficient temporal resolution to capture relevant neural activity within the key frequency bands (delta, theta, alpha, beta, and gamma). This sampling rate is consistent with standards in EEG research and ensures the preservation of information necessary for time-frequency and event-related analysis.
Results
Using 100 subjects, we carried out an EEG evaluation to investigate how our brains respond to social media engagement. The plan was to observe how various brainwave patterns—Alpha, Beta, Theta, Delta, and Gamma—change as people view content and engage with it. For about half an hour, the groups went over their chosen social media sites, and we monitored their brain activity all through.
Alpha brainwaves (peace and rest)
Most people had fairly high Alpha activity, which meant they were calm and relaxed before social media. This is the brain in its “relaxed” state.
As users began to engage on their feeds, alpha activity started lowering right away. This decrease implies the brain not being as calm any longer; it was reacting to the material, processing information, and paying attention.
After people ceased to employ social media, Alpha waves came back up. Those who landed more emotionally charged or demanding positions (like debates or news) nevertheless took longer to get back to that calm state.
Beta Waves (Focus and Alertness)
Beta waves were at a normal level before engagement, which is usual for daily activities.
Beta waves increased in particular as individuals paid more attention on the material they came across—posts, photos, and videos—during social media engagement. The brain was working hard to process everything that was coming at it—whether it was deciding whether to like a post or figuring out the meaning behind a status update.
For several people, beta waves stayed elevated for a time after they had ended. This implies that demanding or even emotionally filled information kept the brain a little “on edge” for a while.
Theta Waves (reflection or relaxation)
Before Attention: Theta waves were quite low, which is exactly what one would notice when fully wide awake and attentive.
Some people had a little rise in Theta waves during involvement. This relates to somewhat dreamy, laid-back attitudes. It could take place when people were passively browsing—neither too deeply eng* nor too deeply eng* still taking in information.
After they stopped using social media, some people still had higher Theta activity for a few minutes, particularly if the content they interacted with was introspective or emotional. The brain seemed to be still working through everything they observed.
Resting and exhausted delta waves.
The brain was totally aware since delta waves were practically non-existent.
During Engagement Delta waves stayed low but did display a slight rise in individuals who spent longer times on social media, especially after 20+ minutes. This could be an indication of early mental sluggishness.
Others kept having higher Delta waves for a little time after, implying that excessive social media browsing can leave us mentally exhausted.
Gamma Waves (Cognitive Processing and High-Level Attention)Math Operating
Before engagement, gamma activity, as anticipated in a tranquil, non-stimulated state, was low.
During Engagement: There was a clear spike in Gamma waves, particularly in those who were very engaged with stimulating or thought-provoking content. This could range from a mind-bending post to a sophisticated, heartfelt video.
Following engagement, particularly in something mentally challenging or emotionally extreme, gamma waves remained elevated for a short time after users had stopped using social media.
Where the Action Took Place:
Particularly during emotionally charged or decision-making events, this region was quite active. Beta and Gamma waves took over here, whether it was deciding how to reply to a post or engaging in a contentious debate. With the Theta waves rising here, the brain was likely recalling or reflecting on memories about what they saw on social media. Expectably, the occipital lobe had much Beta and Gamma activity as the brain analyzed all of the images—photographs, films, and commercials—that constitute a significant component of social media. The parietal lobe: When subjects multitasked—flipping between several kinds of content or various applications—the area illuminated with Beta and Theta waves.
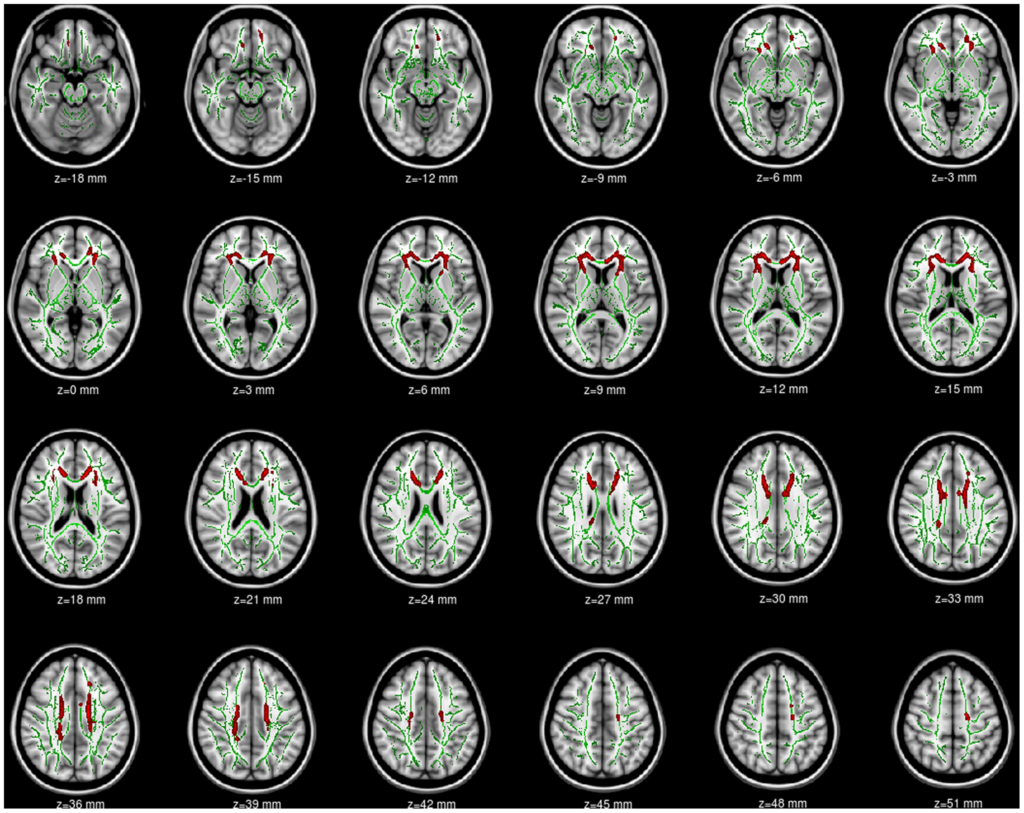
The visualization highlights brain regions where Fractional Anisotropy was significantly lower p less than 0.01, corrected by Threshold-Free Cluster Enhancement in adolescents diagnosed with social media addiction compared to normal control subjects without social media addiction. To make these differences more visually apparent, the regions showing reduced Fractional Anisotropy marked in red have been artificially thickened using the tbss_fill script, which is part of the FMRIB Software Library neuroimaging analysis suite. The results are displayed as an overlay on the Montreal Neurological Institute 152 T1-weighted template along with the mean Fractional Anisotropy skeleton shown in green. For orientation purposes, it’s important to note that the left side of the displayed image corresponds to the right hemisphere of the brain, following radiological convention.
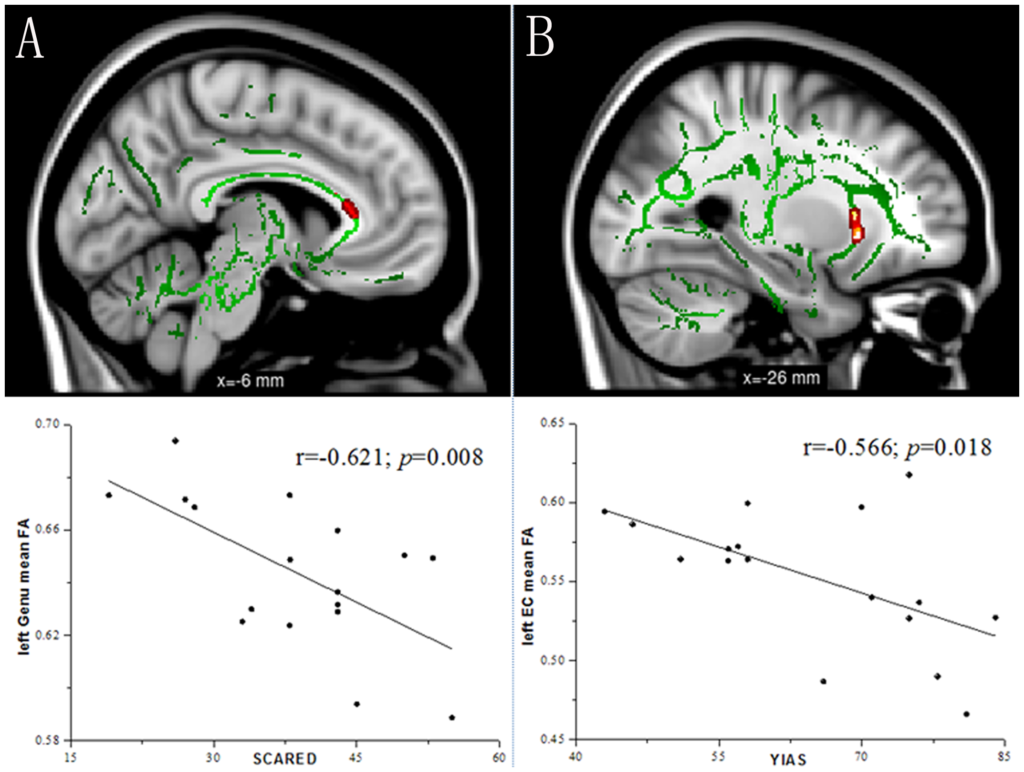
Correlation analysis between fractional anisotropy and behavioral measures within the social media addiction group.
To aid visualization, regions showing significant correlations marked in red are thickened using the tbss_fill script implemented in FMRIB Software Library. Figure 2A shows fractional anisotropy values in the left genu of the corpus callosum correlates negatively with the Screen for Child Anxiety Related Emotional Disorders r equals negative 0.621, p equals 0.008. Figure 2B shows fractional anisotropy values in the left external capsule correlate negatively with the Young’s social media addiction scale r equals negative 0.566, p equals 0.018.
Article Source: Abnormal White Matter Integrity in Adolescents with Internet Addiction Disorder: A Tract-Based Spatial Statistics Study
Lin F, Zhou Y, Du Y, Qin L, Zhao Z, et al. (2012) Abnormal White Matter Integrity in Adolescents with Internet Addiction Disorder: A Tract-Based Spatial Statistics Study. PLOS ONE 7(1): e30253. https://doi.org/10.1371/journal.pone.0030253